With MRII, Esomar and University of Georgia, Lucy and Simon ran our Beyond Storytelling webinar this October, and the response was brilliant, with over 700 sign-ups. So, for anyone who missed it or just want a reminder, we’re sharing the key takeaways.
--
Do you want to be a data-driven firm? So do 74% of other companies. But, in reality, only 29% successfully connect analytics to action (1).
The gap isn’t the quality of the research. It’s the communication strategy – research shows that 75% of insights teams still only use PPT presentations to share their research, and fewer than 10% use creative formats, such as interactive videos or infographics (2).
And with the introduction of AI, it’s here to ‘help us’… and indeed we can take advantage of its radical speed and scalability, hyper-personalisation, and support the shift from reporting to decision enablement. But research also shows that communicating insights powerfully and effectively is not just an AI-driven question-and-answer engine, and only 3% of top-ranking content is pure AI (analysed from 42,000 pieces of content) (3). As our study with Flora shows (4), when it comes to creative outputs, AI alone is not your friend.
We have all done the storytelling training. But we need to go beyond that to ‘sell’ our stories into our organisations.
Knowing this… Here are three things to consider to help you do that:
1. Great insight without a clear message is just noise.
Getting the data right is important, but just as important is distilling everything you found out into a single, sharp key message – if only one thing, what is it you want your audience to walk away with?
Then, you build how and what you communicate around this key message.
2. The structure of persuasion – this time for insights professionals
Lucy and Simon walked through the three pillars of persuasion, as told by Aristotle.
Logos (does the data support it?), ethos (why should I believe this?), and pathos (why should I care?) – tying all three together is how you actually move people to act.
3. How you present your data controls the narrative.
The same numbers, in a different chart, tell a completely different story. The format you choose isn’t neutral, and it will shape what your audience concludes. It’s not just a matter of what a stacked bar chart, a line graph or a pie chart convey, it’s about embedding all of these into the context and ensuring they address the core business question.
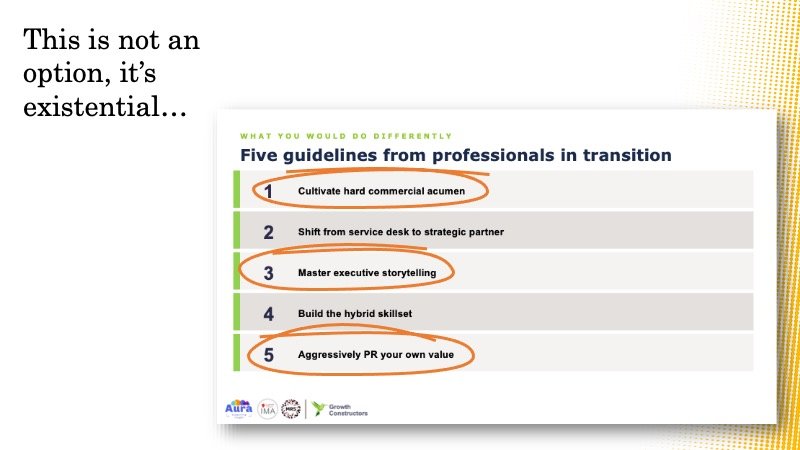
Controlling the narrative for your insights is not an option; it’s existential. Research by Nick Rich with the MRS, Aura and Insights Association, with senior researchers who had lost their jobs (5) tells us that to survive in this brave new world, we need commercial acumen, great storytelling, and to PR ourselves to survive. Because as Simon Chadwick is fond of pointing out, an insight that is not used to the benefit of the organisation is not an insight at all.
--
Do you need an upgrade to your insights communication? Lucy and Simon will be extending the training with MRII next year, and can also bring this session to you, tailored to your specific communication challenges. Get in touch at simon@mustardmarketing.com. We’d love to make it relevant to what you’re actually working on.
Keep an eye out for more MRII webinars with Simon and Lucy.
[1] Forrester, Think you want to be ‘Data-Driven’? Insights is the new Data (Forrester Blog, March 2016)
[2] InSites Consulting / Gen2 Advisors, MR Impact Study, 2014; n=185 market research users
[3] SEMrush analysis of 42,000 blog pages
[5]